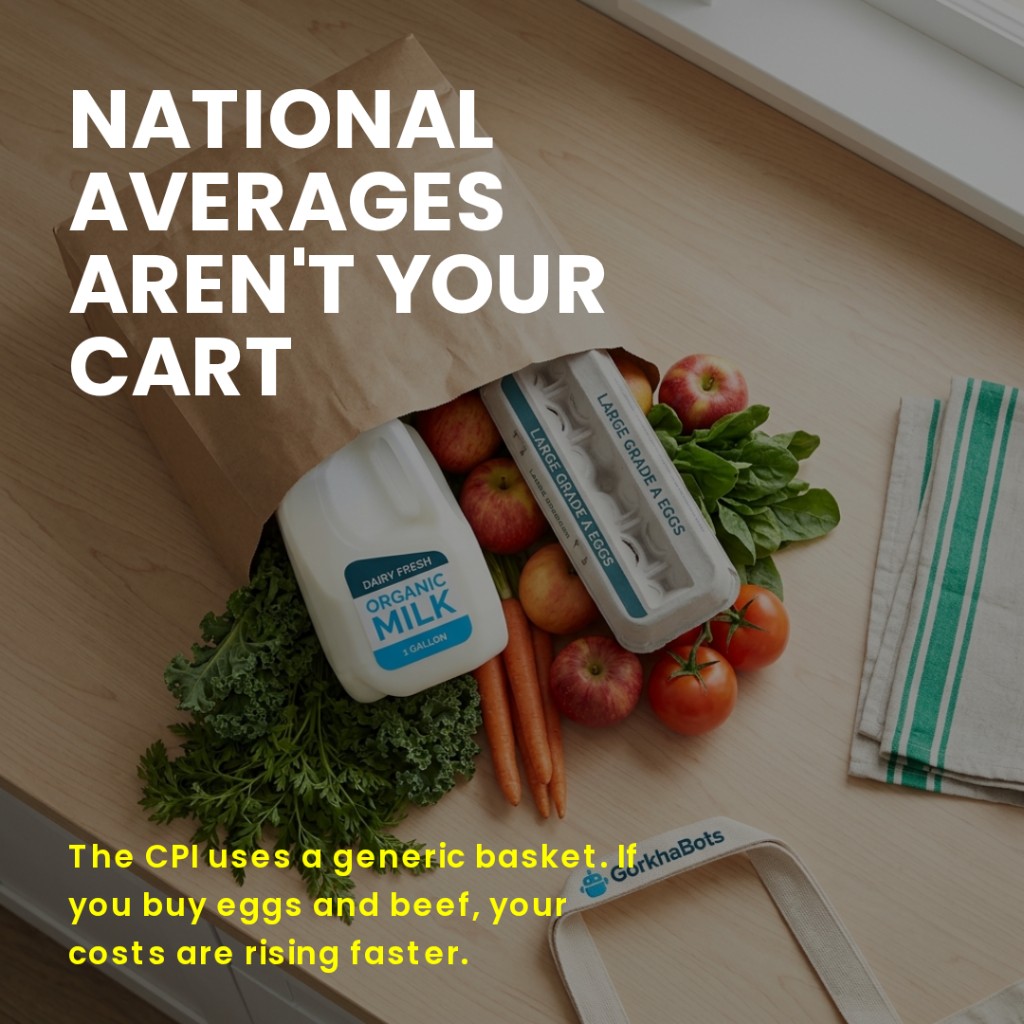
Every few weeks a new headline tells me food prices are up some percent. I read it. I nod. I go to the grocery store and my cart still comes out to more than I expected.
For a long time I assumed the disconnect was psychological. Maybe I was just noticing the prices more because I was paying attention. Maybe I was buying more.
Then I started tracking my actual receipts at the item level and I found something different. The national number and my number are not the same number. In some categories, they are not even close.
What the CPI food number actually measures
The Consumer Price Index food-at-home figure is a monthly survey of prices across a fixed basket of goods, averaged across thousands of retail outlets around the country. The Bureau of Labor Statistics publishes it and the press runs it as "groceries are up X percent."
That number is real. The methodology is sound. But it measures a national average of a fixed basket, and your cart is not that basket.
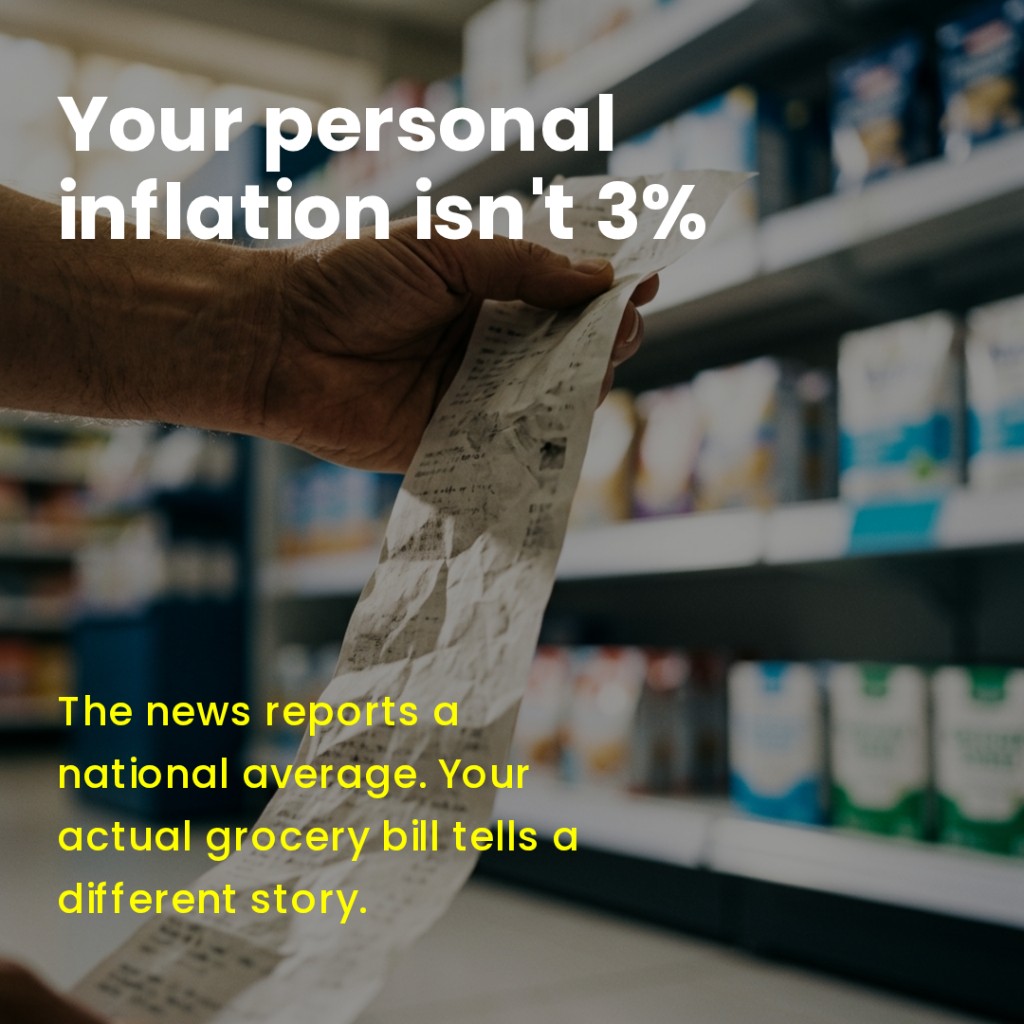
The national average smooths over enormous variation. Produce prices move fast and unevenly based on weather, supply chain, and regional distribution. A household that buys a lot of meat and dairy inflates differently than one that skews toward produce and grains. A household near a Trader Joe's inflates differently than one near a Walmart Supercenter.
The headline number is not wrong. It just does not describe you.
The July 2026 CPI release made that unusually easy to see. Groceries rose 2.7% over the year, and inside that one figure eggs fell 25.7% while tomatoes rose 12.8%. We took the whole report apart in inflation cooled in July, your groceries are still up 33% since 2019.
Why your bank app cannot tell you your real number
We have written before about why your bank app cannot see inside a receipt. When you spend $87 at Target, the app sees one transaction: "Target, $87." It does not know how much of that was paper towels, how much was birthday wrapping, and how much was food.
The same limitation applies to inflation. If your "Groceries" category shows that you spent $650 at Ralphs in March and $780 in October, your budgeting app might flag that as a $130 increase. But it cannot tell you whether that increase is because you bought more, because prices went up, or because you added a case of sparkling water to your usual order.
To measure your actual grocery inflation you need the item level. You need to know that you bought a large tomato in March and a large tomato in October, and then you need to compare the two prices.
Bank apps do not have that. Mint did not have it. YNAB does not have it. Budgeting apps built on bank-feed data never will, because bank feeds carry the merchant total, not the line items.
What receipt-level data actually shows
When I started scanning my receipts into BiteSpend and it accumulated enough history to run same-store price comparisons, I pulled my Mission Ranch Market data.
The swings were not subtle.
From BiteSpend same-store price movement card. Data computed from actual scanned receipts at one store. Results vary by location and shopping patterns.
Those are not rounding errors. Those are items I buy regularly, at the same store, and the price nearly tripled in some cases. None of that showed up in a bank app. None of that showed up in a budgeting category. It was invisible until I had the receipt history to surface it.
American cucumber was down 78%. Green onion was down 52%. So it is not all in one direction. Some things are cheaper than they were. But I had no way to know which without the item-level data.
This is the gap the national CPI number papers over. Your cart has winners and losers every month. The average hides both.
The math nobody does for you
Here is the version of inflation tracking that would actually help most households: take the twenty items you buy every month, compare what each one cost six months ago at your usual store, and compute the weighted average based on how much of each you actually buy.
That is your personal grocery inflation rate. It accounts for your diet, your stores, your region, and your actual purchase frequency. It is the number that tells you whether your food budget needs to go up, whether it is a pricing problem or a habit problem, and which specific items are doing the most damage.
Nobody does this math for you. Not BLS, not your bank, not your budgeting app. It requires item-level data across time, and almost no one has that data in a form they can actually use.
What I built and why
I built BiteSpend because I was trying to do this math myself and could not find a tool that did it.
Photograph a receipt. AI extracts every line item in a few seconds. Over months of scanning, BiteSpend builds a price database across the stores you actually shop at. The same-store price movement card shows you which items at your anchor store have swung most in the past six months. The inflation that matters is the one hitting the specific things in your cart, not a national composite.
Disclosure: I built this app. These are my own receipts and my own numbers. I am showing them because they illustrate the gap, not to claim my experience is universal.
Available on iPhone and Android. Free to start.
What to do if your number is high
If you run the same exercise and find that your personal grocery inflation is significantly higher than the headline number, there are three levers worth pulling before cutting your overall budget.
- Know which items are actually driving it. Not all inflation is equal. A staple you buy every week that went up 30% hits your budget far harder than a specialty item you buy once a month. In my case, produce was the problem, not meat or dairy, which meant adjusting which produce I was buying rather than cutting the whole category.
- Know which stores are cheaper for the things you actually buy. Regional price variation is real. For some items, switching stores saves more than couponing or buying in bulk. The items where the spread is wide enough to justify a trip elsewhere are the ones worth knowing about.
- Know the difference between a spike and a new baseline. Tomatoes up 195% might be a seasonal correction that reverses in six weeks, or it might be a permanent move. Tracking over time tells you which. A spike you can wait out. A permanent move you adjust to.
None of these decisions is possible without the item-level history. With it, the response to a high grocery number becomes specific instead of vague.
The number that actually applies to you
The next time you see a grocery inflation headline, consider that the number almost certainly does not describe your cart.
Your inflation rate depends on what you buy, where you buy it, and how often. It moves independently of the national average. It may be higher or lower. You cannot know without looking at your own data.
The good news is that the data is already there every time you come home from the store. It is on the receipt in your hand. It just needs somewhere to go.
For more on why your bank app misses most of what actually happens inside a grocery run, see this post on what's inside a $87 Target receipt. For why food is the budget line worth caring most about, see this one on variable spend. For the same argument made with the government's own data instead of one person's receipts, see what the July 2026 CPI report actually said.
Find your actual grocery inflation rate.
BiteSpend is live on the App Store and Google Play. Scan any receipt and start building your personal price history. Free to start.
Download on the App Store Get it on Google Play