The Bureau of Labor Statistics released the August 2026 Consumer Price Index this morning at 8:30am Eastern. Headline inflation held at 3.4% year over year, exactly where it sat in July. Markets were watching this one closely: the Fed meets next week, and a hot enough print was expected to push them toward a rate hike.
The number that stayed flat is not the interesting part of this report. Two things underneath it are.
Groceries cooled. Headline didn't. Here's the gap.
Food at home rose 2.2% year over year in August, down from 2.7% in July. That's the calmest grocery reading in a while. Headline inflation held at 3.4% anyway, unchanged from the month before, and the reason has nothing to do with food.
Gasoline accounted for more than a third of August's entire monthly CPI increase, according to the BLS release, as oil climbed back over $100 a barrel on Iran war disruptions to Middle East shipping lanes. Gas was up nearly 4% in the month and more than 27% year over year. That is what kept the headline number hot. Your grocery bill was doing the opposite of what the headline number implies.
Eggs just did something they have not done in a year and a half
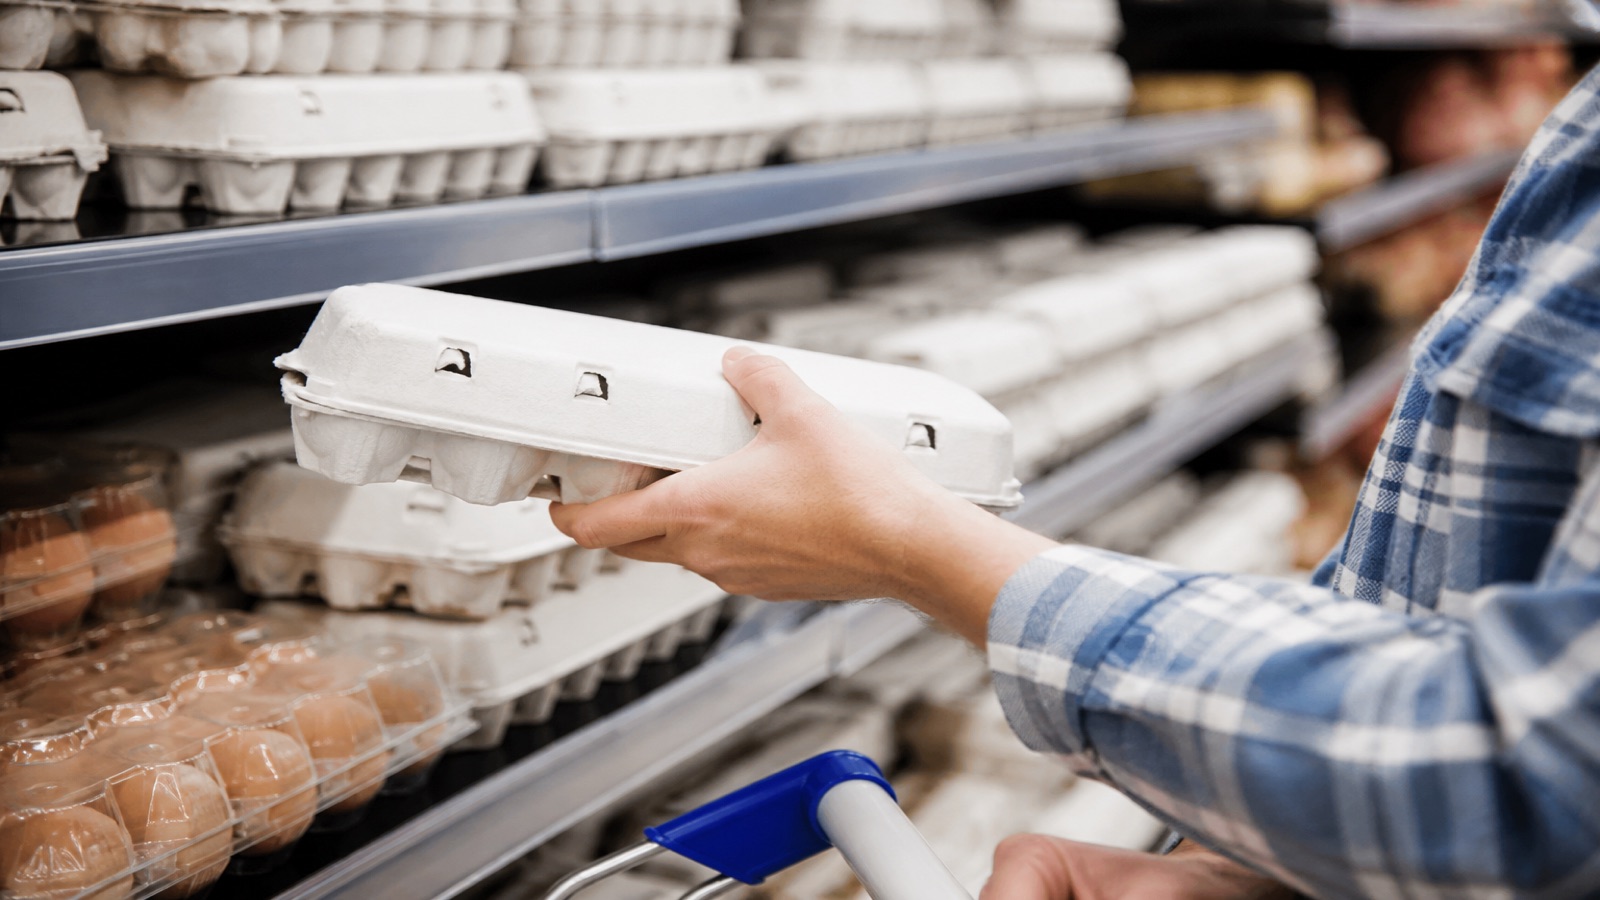
The egg price index rose 3.5% from July to August. That is the first monthly increase since March 2025. Every single month in between, sixteen straight readings, the index went down.
The average price series, which tracks actual dollars per dozen rather than a quality-adjusted index, confirms this is real and not a methodology quirk: $2.19 in July to $2.27 in August. Eggs are still down 36.7% from a year ago on that measure, and still down 23.0% on the CPI index. Both of those year-over-year numbers are accurate. Neither one tells you that the trend they are describing just turned around.
This is exactly the blind spot a 12-month comparison has. It reports direction relative to a year ago. It cannot report a turn that happened three weeks ago, because a turn is a change in the second derivative, and YoY only ever shows you the first.
Your own receipts don't have that blind spot. BiteSpend tracks item-level prices at the stores you actually shop, month to month, so a turn like this shows up in your own history immediately, not eighteen months later in a footnote. Free on iOS and Android.
The spread narrowed, a lot
In July, the gap between the best-performing and worst-performing grocery item we track was 38.5 percentage points, eggs at -25.7% against tomatoes at +12.8%. In August, that spread compressed to 30.2 points, eggs at -23.0% against ground beef at +7.2%.
Unadjusted 12-month change. Source: BLS CPI news release, August 2026, series CUUR0000SEFH and related, pulled programmatically via the public BLS API on release day.
A narrower spread means the national grocery basket is behaving more like a single number this month than it was in July, when eggs and tomatoes were nearly 40 points apart. That is worth watching for next month: is this genuine convergence, or a one-month coincidence that widens right back out.
What actually drove the headline: oil, not food
The Iran war passed the six-month mark at the end of August, and by every account it is getting worse rather than better. Oil crossed back over $100 a barrel this week for the first time since mid-May. Gasoline was up nearly 4% in the month and more than 27% year over year. Diesel hit $6 a gallon on Friday, a record.
Diesel matters more to a grocery budget than the pump price you personally pay, because diesel is what moves food and farm equipment. Economists quoted in coverage of this report flagged it directly: sustained diesel costs at this level eventually show up on shelves, with a lag, because trucking and hauling costs flow through the supply chain into the price of everything that has to get from a farm to a store.
That is the mechanism to watch for the next few months. If the war keeps going, the energy shock currently visible mainly at the gas pump has a plausible path into the food data we track here, weeks or months from now, and it would not show up as a grocery-specific story when it arrives. It would look like a "food at home cost more than expected" month with an oil war three degrees removed from the receipt.
Where this leaves your grocery budget
Two things are true of this report and they point in different directions. Groceries genuinely cooled: 2.2% is the calmest food-at-home reading in a while, and the spread between categories narrowed. At the same time, headline inflation held at an uncomfortably high 3.4% for a reason that has nothing to do with your cart and everything to do with a war affecting oil shipping lanes, and that same mechanism has a real, if lagged, path back into food prices through freight costs.
Neither the 3.4% nor the 2.2% describes your specific grocery bill. Your basket is not the national basket, and if you buy a lot of eggs, this is the first month in a year and a half you might actually notice it on the receipt instead of just reading about it not moving.
Disclosure: we build BiteSpend, the receipt-tracking app referenced in this post. The BLS figures above were pulled directly from the public BLS API on release morning, not estimated or cached from a prior month.
Find out what your number actually is.
Scan a receipt and BiteSpend starts building your own price history, item by item, at the stores you actually shop. Free to start, no bank linking.
Download on the App Store Get it on Google PlaySources. U.S. Bureau of Labor Statistics, Consumer Price Index news release for August 2026, published September 11, 2026, series CUUR0000SA0, CUUR0000SAF11, CUUR0000SEFH and related item series, and APU0000708111 for the average price of a dozen grade A large eggs, all pulled via the public BLS Data API on release morning. War and energy market context from CNBC's August 2026 CPI coverage, published September 11, 2026. This post describes economic data and household budgeting. It is not investment advice.